> ## Documentation Index
> Fetch the complete documentation index at: https://documentation.outpost.pub/llms.txt
> Use this file to discover all available pages before exploring further.
# Outpost Dashboard
> Track member growth and donations for your publication's membership side, with time-period and member-type filters.
The Outpost Dashboard is the live admin view for the membership side of your publication. It shows member growth over time and donation activity, filterable by time period and member segment. It lives under **Reports & Activity → Outpost Dashboard** in the sidebar.
Outpost ships two live dashboards under **Reports & Activity**:
* **Outpost Dashboard** *(this page)* — member growth and donation activity.
* [**CTA Dashboard**](/features/cta-dashboard) — CTA views, signups, conversions, and top-performing posts.
The Outpost dashboards complement Ghost's own dashboard. Ghost shows content and traffic; Outpost shows the subscriber funnel and revenue activity Ghost doesn't surface.
For per-email autoresponder performance, retention funnel metrics, gated PDF stats, email campaign results, and other data not shown on the live dashboard, see the [Daily & Weekly Report Emails](/features/report-emails).
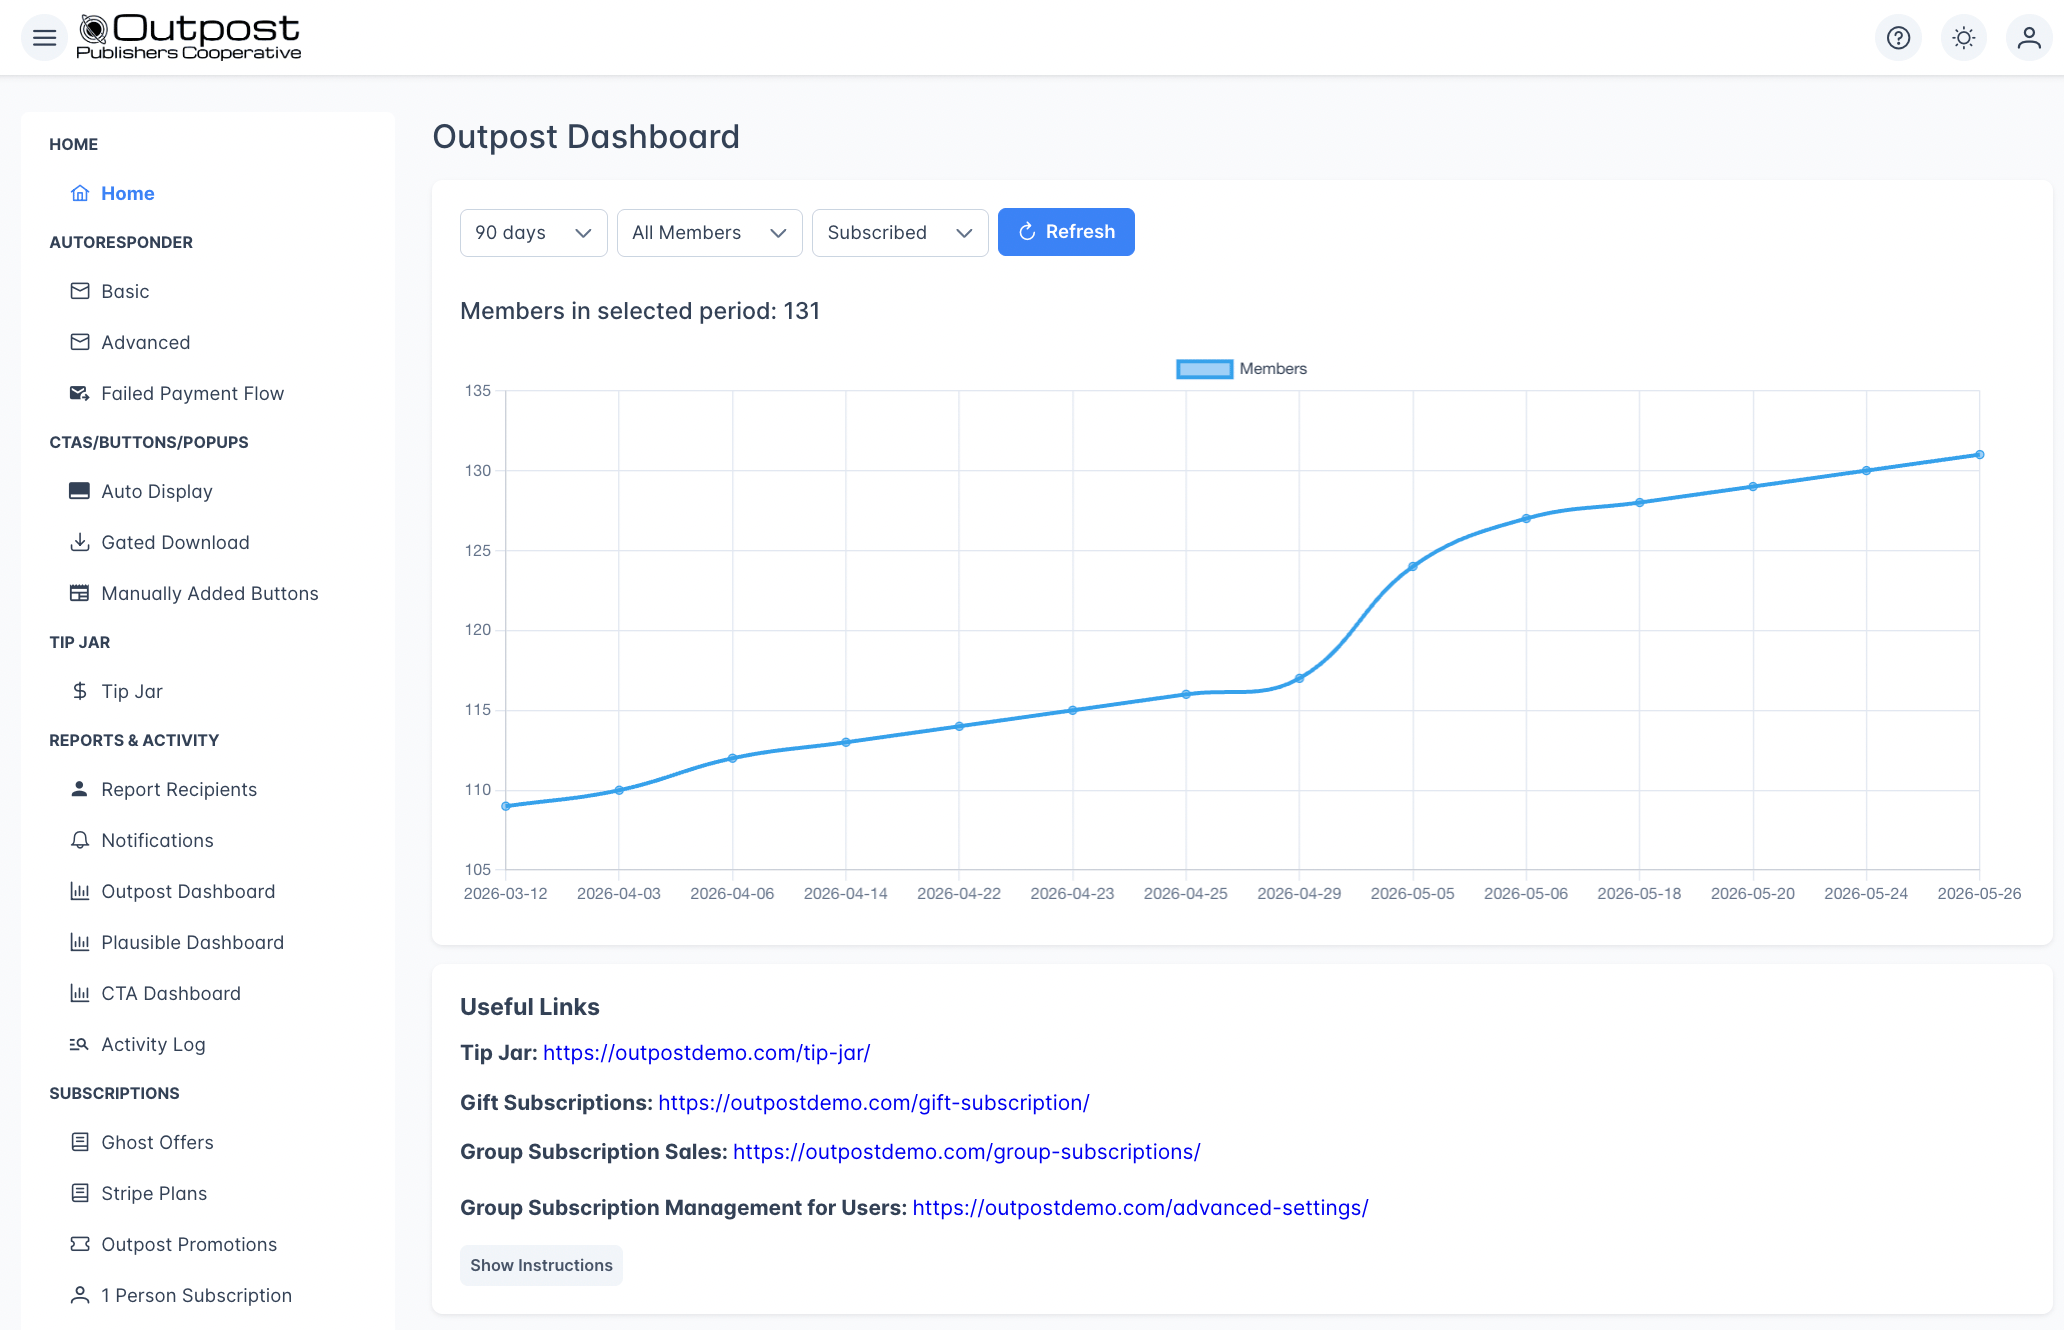 ## Filters
Use the filters at the top of the dashboard to narrow your data. The chart and summary sections update immediately when you change a filter.
| Filter | Options |
| ----------------------- | ------------------------------------------ |
| **Time Period** | 7 days, 30 days, 90 days (default), or All |
| **Member Type** | Free Members, Paid Members, or All Members |
| **Subscription Status** | Subscribed (default) or Unsubscribed |
Click **Refresh** to fetch the latest data. Dashboard data is cached for up to 10 minutes per filter combination, so the refresh returns the cached value if one is still warm.
***
## Member growth
The main chart plots a running cumulative member count over the selected time period — each point on the chart represents the total member count as of that date. An upward slope means your audience is growing.
The header above the chart shows the total members in the selected period.
The chart only includes data points for dates on which at least one member was created, so flat-line days don't show ticks. Net change calculations (net free, net paid, free-to-paid upgrades, reactivations) appear in the [Daily & Weekly Report Emails](/features/report-emails), not on this page.
***
## Donations
If your publication accepts tips via the [Tip Jar](/features/tip-jar), the **Donations** section shows:
* Total donation count and revenue in the selected period
* Breakdown by payment provider — separate totals and counts for Stripe and PayPal
The Donations section only appears once you've received at least one donation.
***
## What's not on this page
The live dashboard focuses on member growth and donations. Other reporting lives in dedicated places:
* **Per-email autoresponder performance** — in the [Daily & Weekly Report Emails](/features/report-emails)
* **Net member change calculations** (net free, net paid, free-to-paid upgrades, reactivations) — in the [Report Emails](/features/report-emails)
* **CTA performance** — see the [CTA Dashboard](/features/cta-dashboard)
* **Site traffic** — see the [Plausible Dashboard](/features/plausible-dashboard) or your Ghost analytics
* **Retention flow funnel, gated PDF signups, email campaign results, custom integration events, page-view trends** — also in the [Report Emails](/features/report-emails)
***
## Related features
Track CTA views, signups, conversions, and top-performing posts.
Daily and weekly emails with the full cross-publication picture.
Privacy-friendly site traffic analytics, embedded in Outpost.
Searchable feed of all member and system events.
***
## FAQ
Ghost's dashboard reports on your content side — posts, page views, and email open rates for newsletters sent through Ghost. The Outpost Dashboard reports on the membership business side — who's signing up, who's converting from free to paid, who's churning, and what your autoresponder lifecycle is doing. They're designed to be used together, not as substitutes.
**90 days** is the default and a good starting point for spotting recent trends. Use **All** for longer-term analysis, and **7 days** for checking the impact of a recent campaign or promotion.
Per-email autoresponder stats (sends, opens, conversions) live in the [Daily & Weekly Report Emails](/features/report-emails), not on this dashboard.
The Donations section appears only if your publication has the [Tip Jar](/features/tip-jar) feature enabled and has received at least one donation in the selected period.
The Outpost Dashboard shows charts and summaries, not raw data. For raw exports, use the [Data Export](/features/data-export) feature or connect [BigQuery](/integrations/bigquery) for continuous data streaming.
## Filters
Use the filters at the top of the dashboard to narrow your data. The chart and summary sections update immediately when you change a filter.
| Filter | Options |
| ----------------------- | ------------------------------------------ |
| **Time Period** | 7 days, 30 days, 90 days (default), or All |
| **Member Type** | Free Members, Paid Members, or All Members |
| **Subscription Status** | Subscribed (default) or Unsubscribed |
Click **Refresh** to fetch the latest data. Dashboard data is cached for up to 10 minutes per filter combination, so the refresh returns the cached value if one is still warm.
***
## Member growth
The main chart plots a running cumulative member count over the selected time period — each point on the chart represents the total member count as of that date. An upward slope means your audience is growing.
The header above the chart shows the total members in the selected period.
The chart only includes data points for dates on which at least one member was created, so flat-line days don't show ticks. Net change calculations (net free, net paid, free-to-paid upgrades, reactivations) appear in the [Daily & Weekly Report Emails](/features/report-emails), not on this page.
***
## Donations
If your publication accepts tips via the [Tip Jar](/features/tip-jar), the **Donations** section shows:
* Total donation count and revenue in the selected period
* Breakdown by payment provider — separate totals and counts for Stripe and PayPal
The Donations section only appears once you've received at least one donation.
***
## What's not on this page
The live dashboard focuses on member growth and donations. Other reporting lives in dedicated places:
* **Per-email autoresponder performance** — in the [Daily & Weekly Report Emails](/features/report-emails)
* **Net member change calculations** (net free, net paid, free-to-paid upgrades, reactivations) — in the [Report Emails](/features/report-emails)
* **CTA performance** — see the [CTA Dashboard](/features/cta-dashboard)
* **Site traffic** — see the [Plausible Dashboard](/features/plausible-dashboard) or your Ghost analytics
* **Retention flow funnel, gated PDF signups, email campaign results, custom integration events, page-view trends** — also in the [Report Emails](/features/report-emails)
***
## Related features
Track CTA views, signups, conversions, and top-performing posts.
Daily and weekly emails with the full cross-publication picture.
Privacy-friendly site traffic analytics, embedded in Outpost.
Searchable feed of all member and system events.
***
## FAQ
Ghost's dashboard reports on your content side — posts, page views, and email open rates for newsletters sent through Ghost. The Outpost Dashboard reports on the membership business side — who's signing up, who's converting from free to paid, who's churning, and what your autoresponder lifecycle is doing. They're designed to be used together, not as substitutes.
**90 days** is the default and a good starting point for spotting recent trends. Use **All** for longer-term analysis, and **7 days** for checking the impact of a recent campaign or promotion.
Per-email autoresponder stats (sends, opens, conversions) live in the [Daily & Weekly Report Emails](/features/report-emails), not on this dashboard.
The Donations section appears only if your publication has the [Tip Jar](/features/tip-jar) feature enabled and has received at least one donation in the selected period.
The Outpost Dashboard shows charts and summaries, not raw data. For raw exports, use the [Data Export](/features/data-export) feature or connect [BigQuery](/integrations/bigquery) for continuous data streaming.